

Download Details
- Version
- 1.21.0 (latest)
- File size
- 1.73 MB
- License
- Free
- Security scan
- VirusTotal: 71 of 71 engines say OK (0 flagged)
- SHA-256 checksum
fbf053db5567d55d20f8d54b8930e95914ffd44073a62ed71ac9048c89d4ecb6- Developer
- alcpu
- Supported OS
- Windows 11, Windows 10, Windows 7
- Installers
- 64-bit (x64), 32-bit (x86), Portable, Offline
- Downloads
- 7725
- Rating
- 4.4 out of 5 · 60 reviews
- File name(s)
- Core-Temp-setup-v1.21.0.207.exe
 Reviewed by Eman Sakr
Tested on Windows 11 and 10 · · How we review
Screenshots
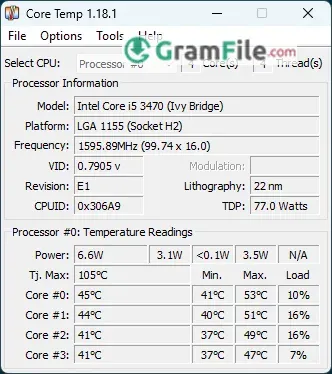
Core Temp is a small, free utility that shows the temperature of every core in your processor. It sits in the system tray and stays out of the way.
It suits anyone who wants a quick answer to “is my CPU running too hot?” while gaming, rendering or overclocking.
It reads only CPU sensors, so you won’t get fan speeds or GPU data. If that is enough, it is worth installing.
What is Core Temp?
Core Temp is a free CPU temperature monitor for Windows from developer ALCPU. It supports Intel, AMD and VIA processors and focuses on one job: showing how hot each core is right now.
It also lists basic processor details such as model, platform, frequency and load, which helps when you need to confirm what chip you have.
Per-core readings taken from the CPU’s own digital sensors
Core Temp reads the digital thermal sensors built into the processor. This is a more direct source than the motherboard-based readings some OEM tools show.
Each core gets its own number, so one overworked core stands out instead of being averaged away.
Tray icons that keep the numbers visible all day
You can show the hottest core or every core as small icons in the notification area. A glance at the taskbar replaces opening the window.
Tip: if the icons are hidden, drag them out of the overflow arrow so they stay on the taskbar.
Min and max values for spotting a cooling problem
Core Temp records minimum and maximum temperatures while it runs. After a long game session or a render, the max value tells you how hot the CPU actually got.
Tip: open Core Temp, start a heavy task, and check the max afterwards. If it sits close to the limit for your CPU, look at your cooler, thermal paste and case airflow.
Overheat alerts and temperature logging
You can set a temperature limit and get an alert when a core reaches it. A logging option records temperature history, which is useful when a crash happens hours into a session.
Core Temp does not control fans or throttle anything on its own. It tells you about the problem, and you do the fixing.
Portable ZIP for USB sticks and repair jobs
The portable package runs from any folder with no installation. This makes it handy for checking a friend’s PC or a machine you do not want to change.
It keeps the same monitoring features as the installed version.
Odd readings on newer Intel and AMD chips
New processors sometimes show missing or wrong values until the tool adds support for them. Recent releases have fixed driver, Ryzen and Intel mapping issues.
Tip: if a core reads 0 or a number looks impossible, update Core Temp and cross-check with HWiNFO before assuming your CPU has a fault.
Gadget, plugins and an Android companion
Core Temp supports plug-ins and a desktop gadget for live graphs. An Android app called Core Temp Monitor Lite lets you watch readings from a phone.
These extras are optional. The base program works fine on its own.
Is Core Temp safe to install?
The installer is checked with VirusTotal and came back clean. Download it only from this page or the developer’s site, never from random mirrors.
Some download paths for this program have been reported to offer optional extra software. Read each setup screen and decline anything you did not ask for.
When a CPU-only thermometer is not enough
Look elsewhere if you need GPU temperatures, fan speeds, voltages or motherboard sensors. Core Temp does not show those.
In that case HWiNFO or Libre Hardware Monitor cover far more sensors, though with a busier screen.
Fixes for common problems
- A core shows 0 degrees or no reading: update to the latest release first, since newer CPUs are added and bugs fixed regularly. Then run Core Temp as administrator.
- The tray load number differs from Task Manager: check the Core Temp settings, then compare with a second monitoring tool before trusting either number.
- Extra software offered during setup: go back a screen and untick or decline the offer, or use the portable ZIP, which has no setup wizard.
Pros & Cons
What we liked
- Free and very lightweight
- Temperature for every CPU core
- Tray icons show readings at a glance
- Portable ZIP needs no installation
- Supports Intel, AMD and VIA
What we didn't like
- Reads CPU sensors only
- No automatic fan or cooling control
- Setup may show optional offers
Best Core Temp Alternatives
-
 iCUE
Control RGB lighting, fan curves, macros and device profiles from one dashboard.
Conclusion
4.4out of 5 · 60 user ratings
Core Temp is a good fit when you only care about processor heat. It starts fast, sits in the tray and gives you honest per-core numbers.
If you want fans, voltages and GPU data on one screen, another monitor is a better match. Here is how the most common options line up.
| App | Best For | Price | Platform | Standout Feature |
|---|---|---|---|---|
| Core Temp | Quick CPU temperature checks | Free | Windows | Per-core readings in tray icons |
| HWiNFO | Detailed hardware diagnostics | Free for personal use | Windows | Very deep sensor and system information |
| HWMonitor | A simple list of all sensors | Freemium | Windows | Temperatures, voltages and fans in one view |
| Libre Hardware Monitor | Open source monitoring | Free | Windows | Open source with ongoing hardware support |
Use Core Temp if you want a light, no-fuss CPU thermometer. Pick HWiNFO if you need a full picture of your hardware.
FAQ
Why does Core Temp show a different CPU load than Task Manager?
The two tools measure and average load in different ways, so small gaps are normal. If the tray number stays far lower than Task Manager under load, check the Core Temp settings and compare with another monitor.
What CPU temperature is too high in Core Temp?
The safe limit depends on your processor, so check your CPU maker’s specifications. As a rule, sustained readings close to that limit under load point to a cooling problem.
Can Core Temp show my GPU temperature?
No, Core Temp reads CPU sensors only. Use a tool such as HWiNFO if you need GPU, fan or motherboard readings.
How do I make Core Temp start with Windows?
Open the Core Temp settings and tick the option to start Core Temp with Windows. In the same settings you can choose which temperatures appear in the notification area.
Why does one core show 0 degrees in Core Temp?
This usually means the sensor is not read correctly on your CPU. Update to the latest release, run Core Temp as administrator, and compare with a second tool.
Does Core Temp work with AMD Ryzen processors?
Yes, Core Temp supports AMD Ryzen along with other AMD, Intel and VIA chips. Newer chips can need the latest release for correct readings.
Found a problem with this download? Report an outdated version, broken link, suspicious installer or incorrect information.
 Internet Download Manager
 Sumatra PDF
 IrfanView
 WinRAR
 PotPlayer
 Google Chrome